Debugging attiny85 code, part 3: Tracing with simavr
This is the third of three posts about using gdb and simavr to debug AVR code. The complete series is:
A walkthrough of using GDB to manually inspect the behavior of our code.
Part 2: Automating GDB with scripts
Creating GDB scripts to automatically test the behavior of our code.
Using
simavrto collect information about the state of microcontroller pins while our code is running.
Prerequisites⌗
In these posts, I will be referencing the code from my pipower project that I discussed in [an earlier post][pipower-post]. If you want to follow along, start by cloning that repository:
git clone https://github.com/larsks/pipower
You’ll also want to be familiar with the attiny85 or a similar AVR microcontroller, since I’ll be referring to register names (like PORTB) without additional explanation.
Goals⌗
In the previous post we looked at we can automate gdb using scripts. In this post, we’ll combine that with the tracing facilities offered by simavr in order to generate traces for pin values and state transitions while the code is running.
Preparing your code⌗
We need to embed some metadata in our code that provides simavr with information about what data we want to collect. We do this by adding some special code that will get embedded in the .mmcu section of the resulting ELF binary. You can see an example of this in sim/simavr.c in the Pipower project:
#include <simavr/avr/avr_mcu_section.h>
#include "pins.h"

extern uint8_t state;

/** Trace data to collect.
 *
 * We collect each bit of PORTB (inputs and outputs) separately. We also keep
 * track of the global state variable.
 */
const struct avr_mmcu_vcd_trace_t _mytrace[]  _MMCU_ = {
    { AVR_MCU_VCD_SYMBOL("PIN_POWER"),    .mask = (1<<PIN_POWER),    .what = (void*)&PINB,  },
    { AVR_MCU_VCD_SYMBOL("PIN_USB"),      .mask = (1<<PIN_USB),      .what = (void*)&PINB,  },
    { AVR_MCU_VCD_SYMBOL("PIN_EN"),       .mask = (1<<PIN_EN),       .what = (void*)&PORTB, },
    { AVR_MCU_VCD_SYMBOL("PIN_SHUTDOWN"), .mask = (1<<PIN_SHUTDOWN), .what = (void*)&PORTB, },
    { AVR_MCU_VCD_SYMBOL("PIN_BOOT"),     .mask = (1<<PIN_BOOT),     .what = (void*)&PINB,  },
    { AVR_MCU_VCD_SYMBOL("STATE"),                                   .what = (void*)&state, },
};
The _mytrace variable (the name is unimportant) is an array of struct avr_mmcu_vcd_trace_t records (the _MMCU_ flag sets an attribute that will embed this data in the appropriate section of the ELF binary). Each record has the following fields:
AVR_MCU_VCD_SYMBOL("...")– this sets the name of a data series to collect..mask(optional) – use this if you only want to collect certain bits. In this example, I am masking out all but a single bit for each pin. I’m not using a mask forstatebecause I want the actual integer value in that case..what– this is the variable to collect. It can be pretty much anything that is in scope. Here,PORTBandPINBare the attiny85 input/output registers, andstateis a global variable frompipower.c
You can build a version of the pipower code that includes this metadata by running, in the sim/ directory:
make TRACE=1
You can see the new .mmcu section of you inspect the section headers of pipower.elf using, e.g., objdump:
$ objdump pipower.elf -h

pipower.elf:     file format elf32-little

Sections:
Idx Name          Size      VMA       LMA       File off  Algn
  0 .text         00000a74  00000000  00000000  00000094  2**1
                  CONTENTS, ALLOC, LOAD, READONLY, CODE
  1 .mmcu         000000de  00000a74  00000a74  00000b08  2**0
                  CONTENTS, ALLOC, LOAD, READONLY, DATA
[...]
Gathering trace data⌗
To gather the trace data with simavr, we simply repeat the steps from the previous post:
- Start
simavr - Run our automated testing script (
simulate.gdb) - Stop
simavr
At the end of this process, we will find a new file in our current directory, gtkwave_trace.vcd. This is a value change dump file, which is a standard format for representing digital signals over time.
Visualizing the trace data⌗
We can view the .vcd file using gtkwave. From the command line, you can run:
gtkwave gtkwave_trace.vcd
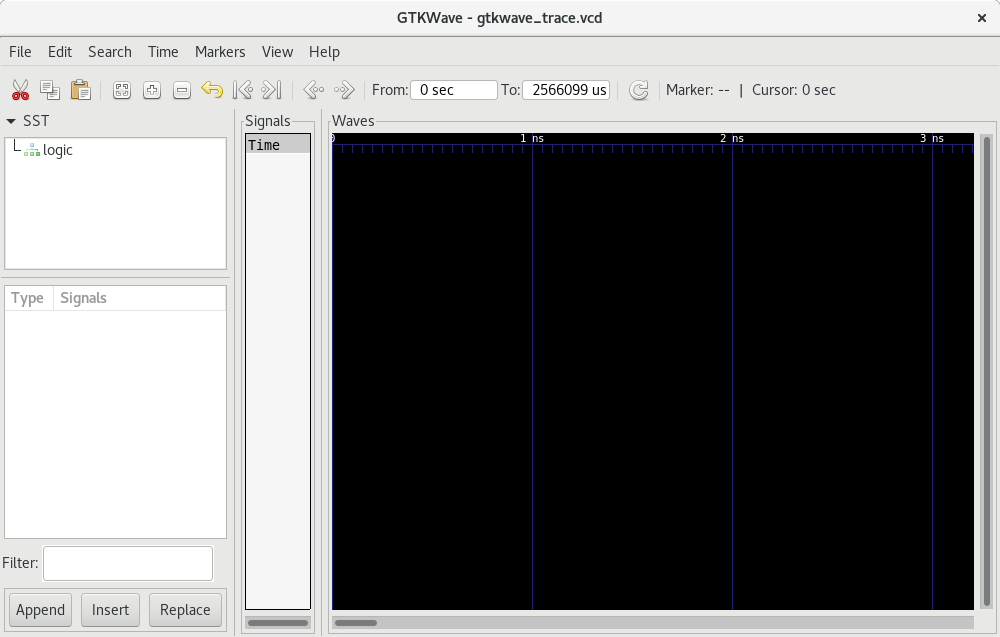
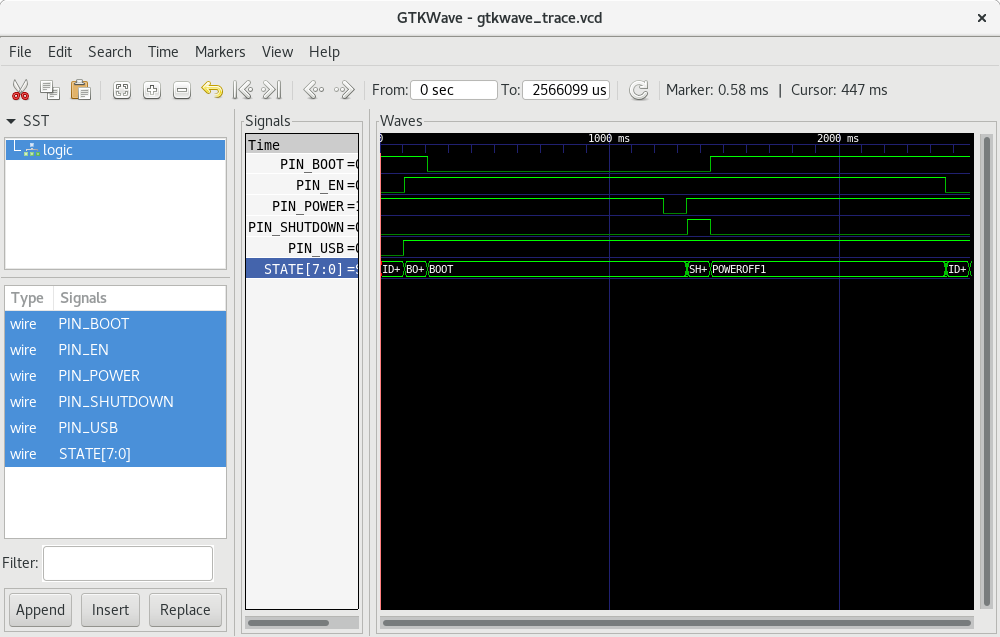
This will bring up the main gtkwave window, which look like this:
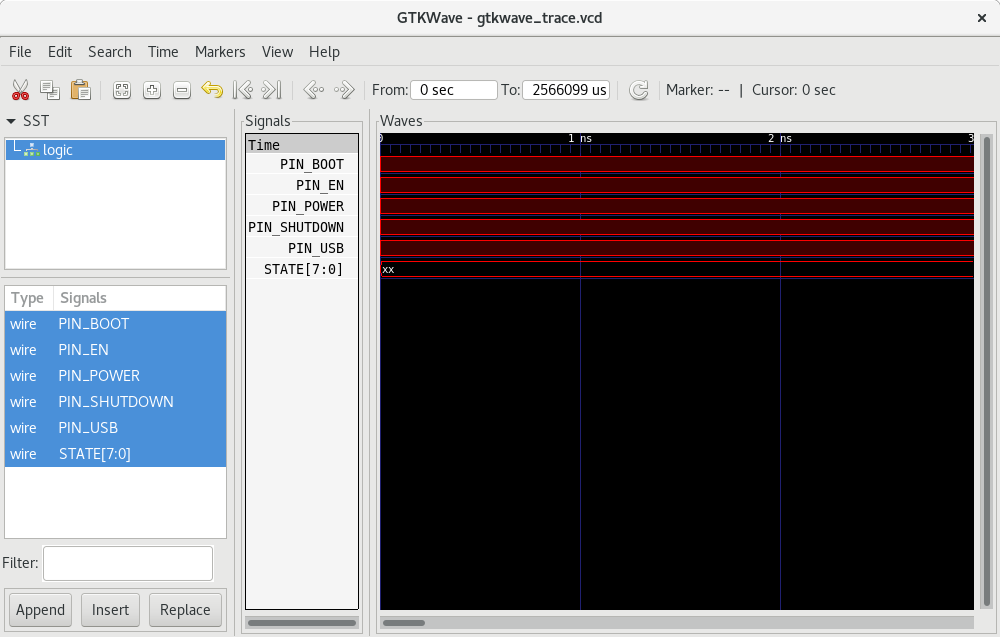
Select logic in the SST (“Signal Search Tree”) pane. This will display the available signals in the next pane down. Select all the signals (click on the top one, then shift-click on the last one) and select “Append”. You should end up with a display that looks like this:
The graph is displaying our collected signal data, but the initial time scale isn’t particularly useful. Select “Time -> Zoom -> Zoom Best Fit”; you should end up with something that looks like:
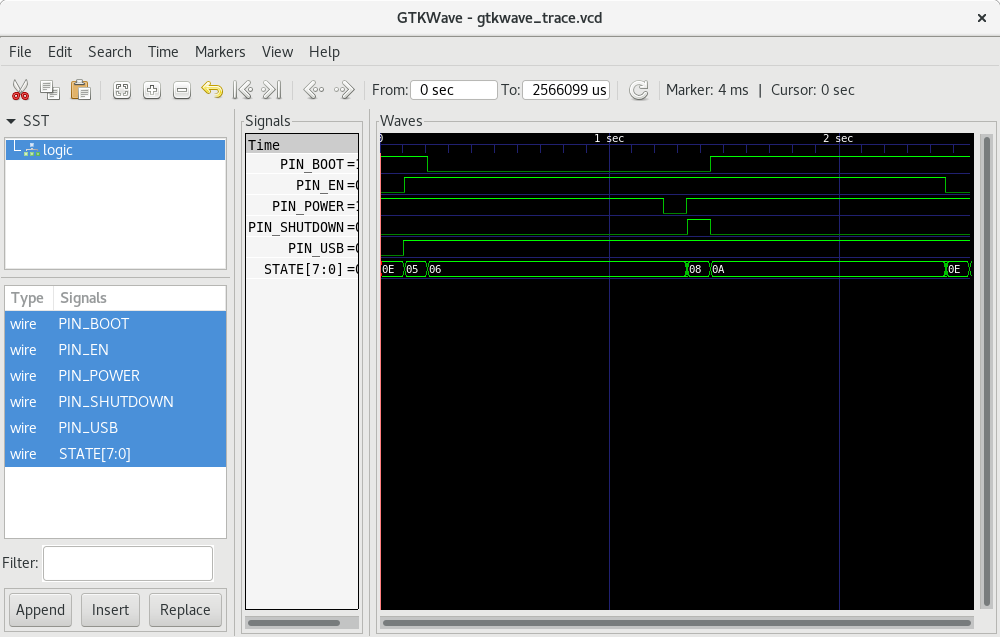
(Note that any time you resize the window you’ll need to manually adjust the zoom level. You can use the menu item, or just press CTRL-ALT-F.)
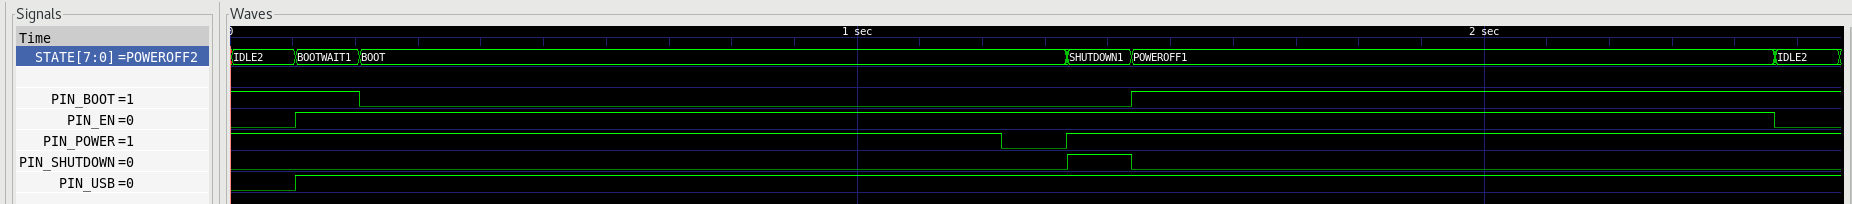
You can now see a graph of how the various pins changed over the runtime of the program. This is a useful way to verify that the code is behaving as expected. In this case, I think the section just past the 1 second mark is interesting; you can see the power button press, followed by PIN_SHUTDOWN going high, then PIN_BOOT going high, and finally PIN_EN disabling power output after the 1 second timer expiry.
You’ll note that the state information is displayed numerically, which isn’t particularly helpful. We can fix that by setting up a “Translate Filter File”. Right click on the STATE[7:0] label in the “Signals” pane, then select “Data Format -> Translate Filter File -> Enable and Select”. In the “Select Signal Filter” window that pops up…
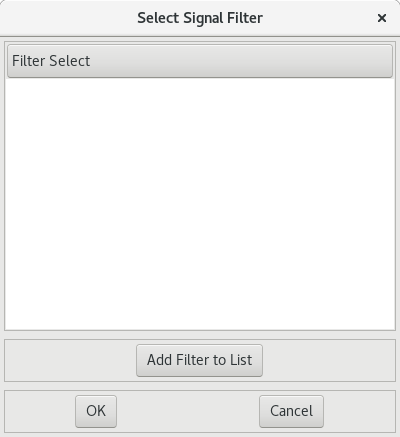
…select “Add Filter to List”. Browse to the sim directory of the pipower project, and select state_filter.txt. Now select that same file in the “Filter Select” list, then click OK. You should now see state names displayed in the graph:
That’s the end of this series of posts on debugging AVR code with gdb and simavr. I hope you found it useful!