How long is a cold spell in Boston?
We’ve had some wacky weather recently. In the space of a week, the temperature went from a high of about 75°F to a low around 15°F. This got me to thinking about what constitutes “normal” weather here in the Boston area, and in particular, how common it is to have a string of consecutive days in which the high temperature stays below freezing. While this was an interesting question in itself, it also seemed like a great opportunity to learn a little about Pandas, the Python data analysis framework.
The first step was finding an appropriate dataset. NOAA provides a daily summaries dataset that includes daily high and low temperature; for Boston, this data extends back to about 1936.
The next step was figuring how to solve the problem. To be explicit, the question I’m trying to answer is:
For any given winter, what was the longest consecutive string of days in which the temperature stayed below freezing?
There are several parts to this problem.
Reading the data#
We can read the data using Pandas’ read_csv method:
df = pandas.read_csv('boston.csv')
This assumes of course that we have previously imported the Pandas library:
import pandas
Now we have a dataframe in df, but it’s using a positional index (i.e., the first item is at index 0, the second at 1, etc), whereas we want it to use a date-based index. The data has a DATE column that we can turn into an appropriate index like this:
df['DATE'] = pandas.to_datetime(df['DATE'])
df.set_index(df['DATE'], inplace=True)
Which winter?#
I need to be able to group the data by “winter”. For example, dates from December 21, 2018 through March 20, 2019 would all be associated with “winter 2018”. It would be easy to group the data by year using Pandas’ groupby method:
df.groupby(df['DATE'].dt.year)...
But what’s the equivalent for grouping by winter? My first attempt was a naive iterative solution:
def get_winter_start(val):
    if (val.month == 10 and val.day >= 20) or val.month > 10:
        winter = val.year
    elif (val.month == 3 and val.day <= 20) or val.month < 3:
        winter = val.year-1
    else:
        winter = 0

    return winter

df['winter_start'] = df['DATE'].apply(get_winter_start)
This works, but it’s not particular graceful and doesn’t take advantage of any of the vector operations supported by Pandas. I eventually came up with a different solution. First, create a boolean series that indicates whether a given date is in winter or not:
df['winter'] = (
    ((df['DATE'].dt.month == 12) & (df['DATE'].dt.day >= 20)) |
    (df['DATE'].dt.month < 3) |
    ((df['DATE'].dt.month == 3) & (df['DATE'].dt.day <= 20))
)
Next, use this boolean series to create a new dataframe that contains only dates in winter. Given this new data, the winter year is the current year for the month of December, or (the current year - 1) for months in Janurary, February, and March:
winter = df[df['winter']].copy()
winter['winter_start'] = (
    winter['DATE'].dt.year - (winter['DATE'].dt.month <= 3))
This seems to do the job. You’ll note that in the above expression I’m subtracting a boolean from an integer, which is in fact totally legal and I talk about that in more detail later on in this article.
Finding a sequence of consecutive days: an iterative solution#
To find the longest sequence of days below freezing, I again started with an iterative solution:
def max_dbf(val):
    acc = []
    cur = 0

    for i, row in val.iterrows():
        if row['TMAX'] <= 32:
            cur += 1
        else:
            if cur:
                acc.append(cur)
                cur = 0
    if cur:
        acc.append(cur)

    return max(acc)
Which I applied using Pandas’ apply method:
res = winter.groupby('winter_start').apply(max_dbf)
This time it’s not just ugly, but it’s also noticeably slow. I started doing some research to figure out how to make it faster.
Finding a sequence of consecutive days: a Pandas solution#
In an answer to this question on Stack Overflow, user DSM suggests that given a series, you can find the longest sequence of consecutive items matching a condition by first creating a boolean series y that is True (or 1) for items that match the condition (and False or 0 otherwise), and then running:
result = y * (y.groupby((y != y.shift()).cumsum()).cumcount() + 1)
Using that suggestion, I rewrote the max_dbf method to look like this:
def max_dbf(val):
    y = val['TMAX'] <= 32
    res = y * (y.groupby((y != y.shift()).cumsum()).cumcount() + 1)
    return max(res)
…and you know what, it works! But what exactly is going on there? There’s a reasonable explanation in the answer, but I’m new enough to Pandas that I wanted to work it out for myself.
Setting the stage#
In order to explore the operation of this expression, let’s start with some sample data. This is the value of TMAX for the month of Janurary, 2018:
data = [
  ['2018-01-01', 13],
  ['2018-01-02', 19],
  ['2018-01-03', 29],
  ['2018-01-04', 30],
  ['2018-01-05', 24],
  ['2018-01-06', 12],
  ['2018-01-07', 17],
  ['2018-01-08', 35],
  ['2018-01-09', 43],
  ['2018-01-10', 36],
  ['2018-01-11', 51],
  ['2018-01-12', 60],
  ['2018-01-13', 61],
  ['2018-01-14', 23],
  ['2018-01-15', 21],
  ['2018-01-16', 33],
  ['2018-01-17', 34],
  ['2018-01-18', 32],
  ['2018-01-19', 34],
  ['2018-01-20', 47],
  ['2018-01-21', 49],
  ['2018-01-22', 39],
  ['2018-01-23', 55],
  ['2018-01-24', 42],
  ['2018-01-25', 30],
  ['2018-01-26', 34],
  ['2018-01-27', 53],
  ['2018-01-28', 52],
  ['2018-01-29', 43],
  ['2018-01-30', 31],
  ['2018-01-31', 30],
  ]

data_unzipped = list(zip(*data))
df = pandas.DataFrame({'DATE': data_unzipped[0], 'TMAX': data_unzipped[1]})
Our initial dataframe looks like this:
| DATE | TMAX | |
|---|---|---|
| 0 | 2018-01-01 | 13 |
| 1 | 2018-01-02 | 19 |
| 2 | 2018-01-03 | 29 |
| 3 | 2018-01-04 | 30 |
| 4 | 2018-01-05 | 24 |
| 5 | 2018-01-06 | 12 |
| 6 | 2018-01-07 | 17 |
| 7 | 2018-01-08 | 35 |
| 8 | 2018-01-09 | 43 |
| 9 | 2018-01-10 | 36 |
| 10 | 2018-01-11 | 51 |
| 11 | 2018-01-12 | 60 |
| 12 | 2018-01-13 | 61 |
| 13 | 2018-01-14 | 23 |
| 14 | 2018-01-15 | 21 |
| 15 | 2018-01-16 | 33 |
| 16 | 2018-01-17 | 34 |
| 17 | 2018-01-18 | 32 |
| 18 | 2018-01-19 | 34 |
| 19 | 2018-01-20 | 47 |
| 20 | 2018-01-21 | 49 |
| 21 | 2018-01-22 | 39 |
| 22 | 2018-01-23 | 55 |
| 23 | 2018-01-24 | 42 |
| 24 | 2018-01-25 | 30 |
| 25 | 2018-01-26 | 34 |
| 26 | 2018-01-27 | 53 |
| 27 | 2018-01-28 | 52 |
| 28 | 2018-01-29 | 43 |
| 29 | 2018-01-30 | 31 |
| 30 | 2018-01-31 | 30 |
Step 1#
We first need to create a boolean series indicating whether or not the temperature is below freezing. We’ll put this into the dataframe as series freezing:
df['freezing'] = df['TMAX'] <= 32
Our dataframe now looks like this:
| DATE | TMAX | freezing | |
|---|---|---|---|
| 0 | 2018-01-01 | 13 | True |
| 1 | 2018-01-02 | 19 | True |
| 2 | 2018-01-03 | 29 | True |
| 3 | 2018-01-04 | 30 | True |
| 4 | 2018-01-05 | 24 | True |
| 5 | 2018-01-06 | 12 | True |
| 6 | 2018-01-07 | 17 | True |
| 7 | 2018-01-08 | 35 | False |
| 8 | 2018-01-09 | 43 | False |
| 9 | 2018-01-10 | 36 | False |
| 10 | 2018-01-11 | 51 | False |
| 11 | 2018-01-12 | 60 | False |
| 12 | 2018-01-13 | 61 | False |
| 13 | 2018-01-14 | 23 | True |
| 14 | 2018-01-15 | 21 | True |
| 15 | 2018-01-16 | 33 | False |
| 16 | 2018-01-17 | 34 | False |
| 17 | 2018-01-18 | 32 | True |
| 18 | 2018-01-19 | 34 | False |
| 19 | 2018-01-20 | 47 | False |
| 20 | 2018-01-21 | 49 | False |
| 21 | 2018-01-22 | 39 | False |
| 22 | 2018-01-23 | 55 | False |
| 23 | 2018-01-24 | 42 | False |
| 24 | 2018-01-25 | 30 | True |
| 25 | 2018-01-26 | 34 | False |
| 26 | 2018-01-27 | 53 | False |
| 27 | 2018-01-28 | 52 | False |
| 28 | 2018-01-29 | 43 | False |
| 29 | 2018-01-30 | 31 | True |
| 30 | 2018-01-31 | 30 | True |
Step 2#
Now we start looking at the various components in our expression of interest. In this step, we are looking at the highlighted part below:
Instead of y, we’re operating on the result of the previous step, df['freezing']. We’ll place the result of this step into a new series named step2 in the dataframe:
df['step2'] = df['freezing'] != df['freezing'].shift()
This gives us the following:
| DATE | TMAX | freezing | step2 | |
|---|---|---|---|---|
| 0 | 2018-01-01 | 13 | True | True |
| 1 | 2018-01-02 | 19 | True | False |
| 2 | 2018-01-03 | 29 | True | False |
| 3 | 2018-01-04 | 30 | True | False |
| 4 | 2018-01-05 | 24 | True | False |
| 5 | 2018-01-06 | 12 | True | False |
| 6 | 2018-01-07 | 17 | True | False |
| 7 | 2018-01-08 | 35 | False | True |
| 8 | 2018-01-09 | 43 | False | False |
| 9 | 2018-01-10 | 36 | False | False |
| 10 | 2018-01-11 | 51 | False | False |
| 11 | 2018-01-12 | 60 | False | False |
| 12 | 2018-01-13 | 61 | False | False |
| 13 | 2018-01-14 | 23 | True | True |
| 14 | 2018-01-15 | 21 | True | False |
| 15 | 2018-01-16 | 33 | False | True |
| 16 | 2018-01-17 | 34 | False | False |
| 17 | 2018-01-18 | 32 | True | True |
| 18 | 2018-01-19 | 34 | False | True |
| 19 | 2018-01-20 | 47 | False | False |
| 20 | 2018-01-21 | 49 | False | False |
| 21 | 2018-01-22 | 39 | False | False |
| 22 | 2018-01-23 | 55 | False | False |
| 23 | 2018-01-24 | 42 | False | False |
| 24 | 2018-01-25 | 30 | True | True |
| 25 | 2018-01-26 | 34 | False | True |
| 26 | 2018-01-27 | 53 | False | False |
| 27 | 2018-01-28 | 52 | False | False |
| 28 | 2018-01-29 | 43 | False | False |
| 29 | 2018-01-30 | 31 | True | True |
| 30 | 2018-01-31 | 30 | True | False |
Looking at the values of step2 in this table, we can see an interesting property: step2 is True only in cases where the value of df['freezing'] changes.
Step 3#
In this step, we apply the cumsum method (“cumulative sum”) to the result of step 2. We store the result in a new series step3 in the dataframe:
df['step3'] = df['step2'].cumsum()
The result looks like this:
| DATE | TMAX | freezing | step2 | step3 | |
|---|---|---|---|---|---|
| 0 | 2018-01-01 | 13 | True | True | 1 |
| 1 | 2018-01-02 | 19 | True | False | 1 |
| 2 | 2018-01-03 | 29 | True | False | 1 |
| 3 | 2018-01-04 | 30 | True | False | 1 |
| 4 | 2018-01-05 | 24 | True | False | 1 |
| 5 | 2018-01-06 | 12 | True | False | 1 |
| 6 | 2018-01-07 | 17 | True | False | 1 |
| 7 | 2018-01-08 | 35 | False | True | 2 |
| 8 | 2018-01-09 | 43 | False | False | 2 |
| 9 | 2018-01-10 | 36 | False | False | 2 |
| 10 | 2018-01-11 | 51 | False | False | 2 |
| 11 | 2018-01-12 | 60 | False | False | 2 |
| 12 | 2018-01-13 | 61 | False | False | 2 |
| 13 | 2018-01-14 | 23 | True | True | 3 |
| 14 | 2018-01-15 | 21 | True | False | 3 |
| 15 | 2018-01-16 | 33 | False | True | 4 |
| 16 | 2018-01-17 | 34 | False | False | 4 |
| 17 | 2018-01-18 | 32 | True | True | 5 |
| 18 | 2018-01-19 | 34 | False | True | 6 |
| 19 | 2018-01-20 | 47 | False | False | 6 |
| 20 | 2018-01-21 | 49 | False | False | 6 |
| 21 | 2018-01-22 | 39 | False | False | 6 |
| 22 | 2018-01-23 | 55 | False | False | 6 |
| 23 | 2018-01-24 | 42 | False | False | 6 |
| 24 | 2018-01-25 | 30 | True | True | 7 |
| 25 | 2018-01-26 | 34 | False | True | 8 |
| 26 | 2018-01-27 | 53 | False | False | 8 |
| 27 | 2018-01-28 | 52 | False | False | 8 |
| 28 | 2018-01-29 | 43 | False | False | 8 |
| 29 | 2018-01-30 | 31 | True | True | 9 |
| 30 | 2018-01-31 | 30 | True | False | 9 |
We’re applying the cumsum method to a boolean series. By doing so, we’re taking advantage of the fact that in Python we can treat boolean values as integers: a True value evaluates to 1, and a False value to 0. What we get with this operation is effectively a “sequence id”: because step2 is only True when the value of freezing changes, the value calculated in this step only increments when we start a new sequence of values for which freezing has the same value.
Step 4#
In the previous step, we calculated what I called a “sequence id”. We can take advantage of this to group the data into consecutive stretches for which the temperature was either below freezing or not by using the value as an argument to Pandas’ groupby method, and then applying the cumcount method:
df['step4'] = df['freezing'].groupby(df['step3']).cumcount() + 1
The cumcount method simply numbers the items in each group, starting at 0. This gives us:
| DATE | TMAX | freezing | step2 | step3 | step4 | |
|---|---|---|---|---|---|---|
| 0 | 2018-01-01 | 13 | True | True | 1 | 1 |
| 1 | 2018-01-02 | 19 | True | False | 1 | 2 |
| 2 | 2018-01-03 | 29 | True | False | 1 | 3 |
| 3 | 2018-01-04 | 30 | True | False | 1 | 4 |
| 4 | 2018-01-05 | 24 | True | False | 1 | 5 |
| 5 | 2018-01-06 | 12 | True | False | 1 | 6 |
| 6 | 2018-01-07 | 17 | True | False | 1 | 7 |
| 7 | 2018-01-08 | 35 | False | True | 2 | 1 |
| 8 | 2018-01-09 | 43 | False | False | 2 | 2 |
| 9 | 2018-01-10 | 36 | False | False | 2 | 3 |
| 10 | 2018-01-11 | 51 | False | False | 2 | 4 |
| 11 | 2018-01-12 | 60 | False | False | 2 | 5 |
| 12 | 2018-01-13 | 61 | False | False | 2 | 6 |
| 13 | 2018-01-14 | 23 | True | True | 3 | 1 |
| 14 | 2018-01-15 | 21 | True | False | 3 | 2 |
| 15 | 2018-01-16 | 33 | False | True | 4 | 1 |
| 16 | 2018-01-17 | 34 | False | False | 4 | 2 |
| 17 | 2018-01-18 | 32 | True | True | 5 | 1 |
| 18 | 2018-01-19 | 34 | False | True | 6 | 1 |
| 19 | 2018-01-20 | 47 | False | False | 6 | 2 |
| 20 | 2018-01-21 | 49 | False | False | 6 | 3 |
| 21 | 2018-01-22 | 39 | False | False | 6 | 4 |
| 22 | 2018-01-23 | 55 | False | False | 6 | 5 |
| 23 | 2018-01-24 | 42 | False | False | 6 | 6 |
| 24 | 2018-01-25 | 30 | True | True | 7 | 1 |
| 25 | 2018-01-26 | 34 | False | True | 8 | 1 |
| 26 | 2018-01-27 | 53 | False | False | 8 | 2 |
| 27 | 2018-01-28 | 52 | False | False | 8 | 3 |
| 28 | 2018-01-29 | 43 | False | False | 8 | 4 |
| 29 | 2018-01-30 | 31 | True | True | 9 | 1 |
| 30 | 2018-01-31 | 30 | True | False | 9 | 2 |
Step 5#
Looking at the results of the previous step, we can see the simply asking for df['step5'].max() would give us the longest sequence of days for which the value of freezing remained constant. How do we limit that to only consider sequences in which freezing is True? We again take advantage of the fact that a boolean is just an integer, and we multiply the result of the previous step by the value of the freezing series:
df['step5'] = df['freezing'] * df['step4']
This will zero out all the values from the previous step in which freezing is False, because False * x is the same as 0 * x. This gives us our final result:
| DATE | TMAX | freezing | step2 | step3 | step4 | step5 | |
|---|---|---|---|---|---|---|---|
| 0 | 2018-01-01 | 13 | True | True | 1 | 1 | 1 |
| 1 | 2018-01-02 | 19 | True | False | 1 | 2 | 2 |
| 2 | 2018-01-03 | 29 | True | False | 1 | 3 | 3 |
| 3 | 2018-01-04 | 30 | True | False | 1 | 4 | 4 |
| 4 | 2018-01-05 | 24 | True | False | 1 | 5 | 5 |
| 5 | 2018-01-06 | 12 | True | False | 1 | 6 | 6 |
| 6 | 2018-01-07 | 17 | True | False | 1 | 7 | 7 |
| 7 | 2018-01-08 | 35 | False | True | 2 | 1 | 0 |
| 8 | 2018-01-09 | 43 | False | False | 2 | 2 | 0 |
| 9 | 2018-01-10 | 36 | False | False | 2 | 3 | 0 |
| 10 | 2018-01-11 | 51 | False | False | 2 | 4 | 0 |
| 11 | 2018-01-12 | 60 | False | False | 2 | 5 | 0 |
| 12 | 2018-01-13 | 61 | False | False | 2 | 6 | 0 |
| 13 | 2018-01-14 | 23 | True | True | 3 | 1 | 1 |
| 14 | 2018-01-15 | 21 | True | False | 3 | 2 | 2 |
| 15 | 2018-01-16 | 33 | False | True | 4 | 1 | 0 |
| 16 | 2018-01-17 | 34 | False | False | 4 | 2 | 0 |
| 17 | 2018-01-18 | 32 | True | True | 5 | 1 | 1 |
| 18 | 2018-01-19 | 34 | False | True | 6 | 1 | 0 |
| 19 | 2018-01-20 | 47 | False | False | 6 | 2 | 0 |
| 20 | 2018-01-21 | 49 | False | False | 6 | 3 | 0 |
| 21 | 2018-01-22 | 39 | False | False | 6 | 4 | 0 |
| 22 | 2018-01-23 | 55 | False | False | 6 | 5 | 0 |
| 23 | 2018-01-24 | 42 | False | False | 6 | 6 | 0 |
| 24 | 2018-01-25 | 30 | True | True | 7 | 1 | 1 |
| 25 | 2018-01-26 | 34 | False | True | 8 | 1 | 0 |
| 26 | 2018-01-27 | 53 | False | False | 8 | 2 | 0 |
| 27 | 2018-01-28 | 52 | False | False | 8 | 3 | 0 |
| 28 | 2018-01-29 | 43 | False | False | 8 | 4 | 0 |
| 29 | 2018-01-30 | 31 | True | True | 9 | 1 | 1 |
| 30 | 2018-01-31 | 30 | True | False | 9 | 2 | 2 |
Step 6#
Now the answer to our question is as simple as asking for the maximum value from the previous step:
max_consecutive_dbf = df['step5'].max()
And if everything worked as expected, we should find that the longest consecutive sequence of days on which the temperature stayed below freezing was 7 days, from 2018-01-01 through 2018-01-07:
assert max_consecutive_dbf == 7
Results#
If we look at the results for the past 20 years, we see the following:
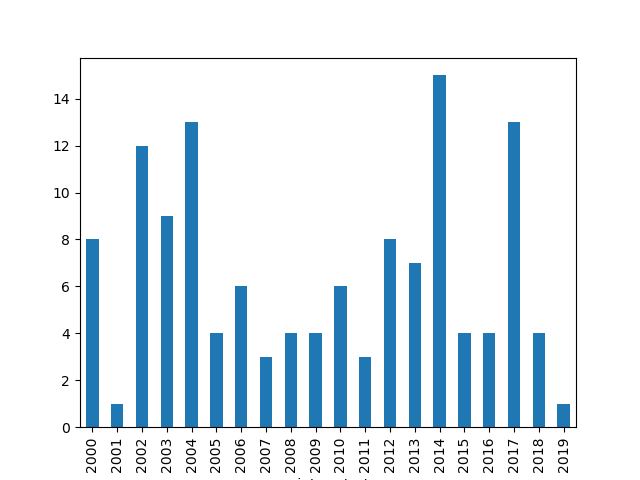
For data used in the above chart, the average stretch in which the temperature stays below freezing is 6.45 days (the average for the entire dataset is 6.33 days).